seaborn subplots
複数のグラフを表示
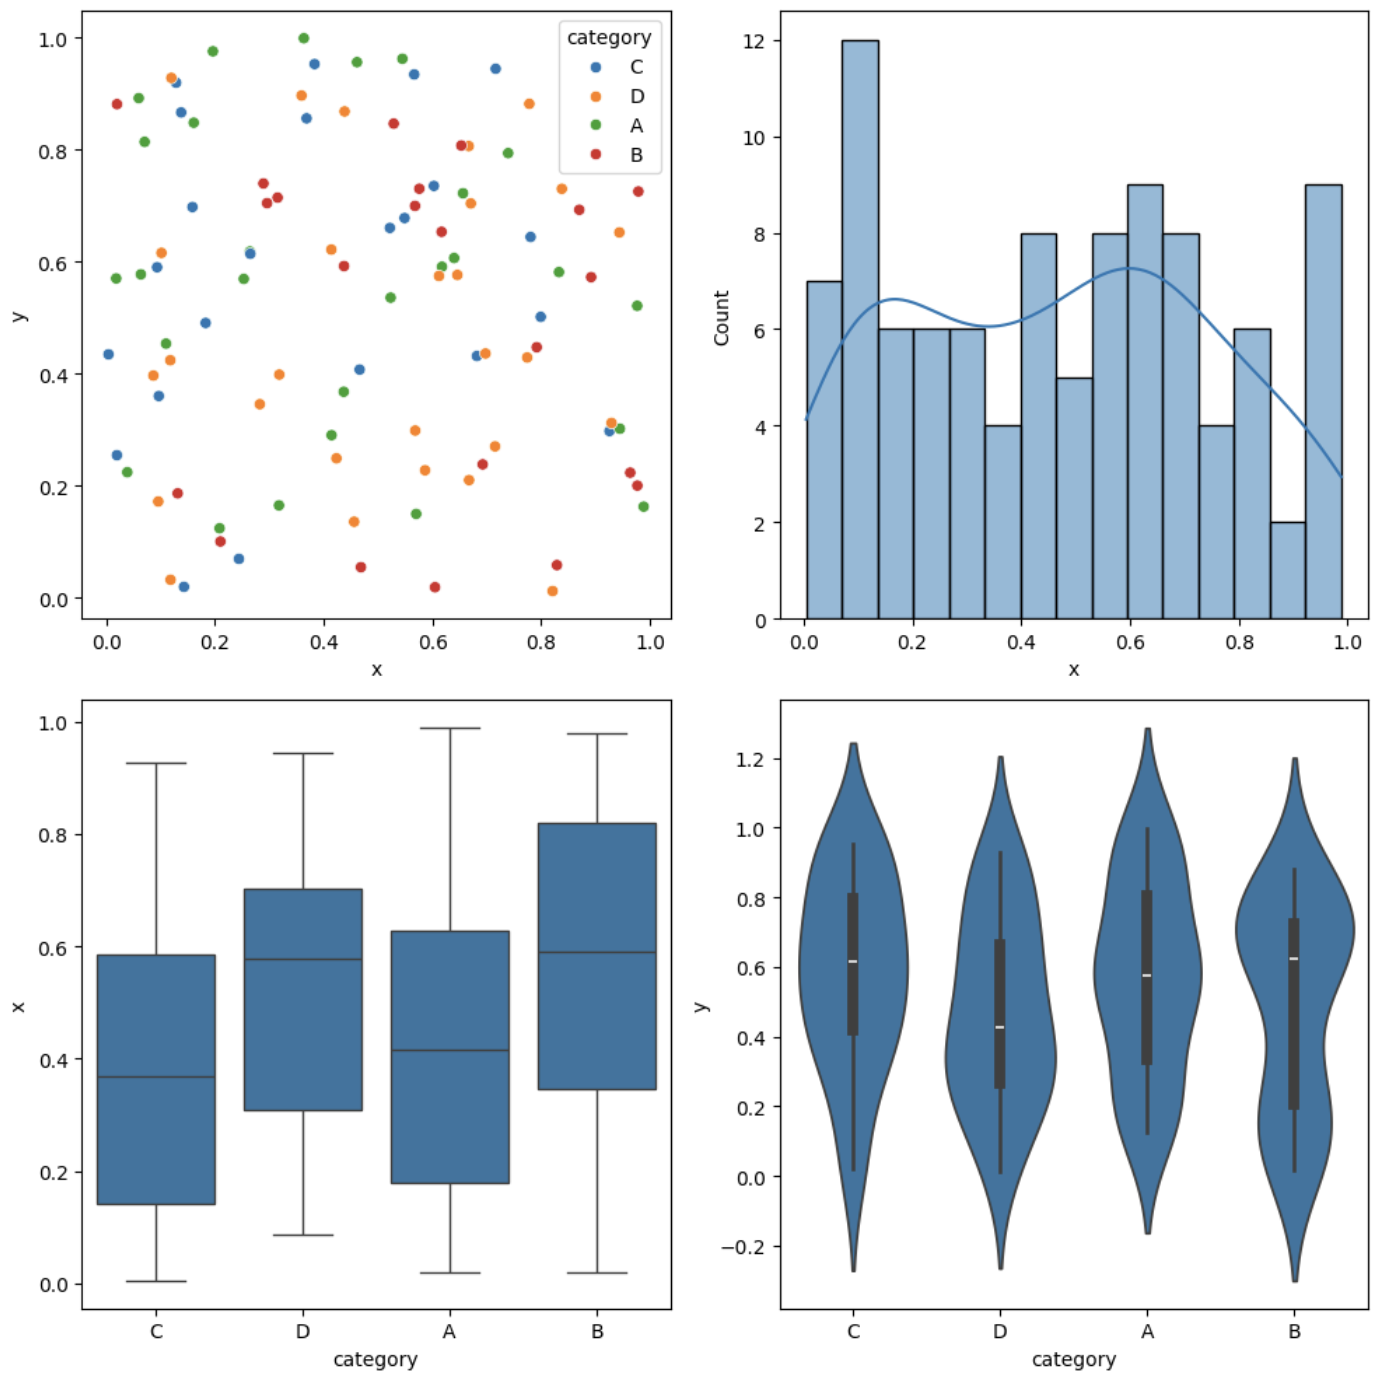
plt.subplotsではじめに描画マトリクスaxsを作成しておき、後からsns.描画関数の引数に入れて描画する
# 例示のためのランダムデータを生成
np.random.seed(0)
data = pd.DataFrame(data={
    'x': np.random.rand(100),
    'y': np.random.rand(100),
    'category': np.random.choice(['A', 'B', 'C', 'D'], 100)
})

# 2行2列のサブプロットを作成
# y, xの順序
fig, axs = plt.subplots(nrows=2, ncols=2, figsize=(10, 10))

# 1つ目のサブプロットに散布図を描画
sns.scatterplot(x='x', y='y', hue='category', data=data, ax=axs[0, 0])

# 2つ目のサブプロットにヒストグラムを描画
sns.histplot(data['x'], bins=15, kde=True, ax=axs[0, 1])

# 3つ目のサブプロットに箱ひげ図を描画
sns.boxplot(x='category', y='x', data=data, ax=axs[1, 0])

# 4つ目のサブプロットにバイオリンプロットを描画
sns.violinplot(x='category', y='y', data=data, ax=axs[1, 1])

# グラフのレイアウトを整える
plt.tight_layout()
plt.show()
機械的にindexを決定
- modを利用して描画するindexを決定する
# box-coxを描画する例
plt.figure(figsize=(30, 30))
f, axs = plt.subplots(nrows=7, ncols=3, figsize=(30, 30))
for i, l in enumerate(np.arange(0.0, 2, 0.1)):
    if l == 0.0:
        y = np.log(x)
    else:
        y = (x**l - 1)/l
    sns.distplot(y, kde=False, ax=axs[i//3, i%3])
    axs[i//3, i%3].set(title=f"lambda = {l:0.2f}")