python yfinanceの使い方
概要
- pythonで株価データを取得するためのライブラリ
- アメリカの株価データを取得することができる
XXXX.Tと指定することで東証の株価データも取得することができる- e.g.
1655.Tで東証のS&P500を取得することができる
- e.g.
インストール
$ pip install yfinance
使い方
import pandas as pd
import yfinance as yf
hists = []
for ticker in ["DIA", "VOO", "QQQ",]:
obj = yf.Ticker(ticker)
# get historical market data
hist = obj.history(period="36mo")
hist = hist.reset_index()
hist["date"] = pd.to_datetime(hist["Date"]).dt.date
hist["ticker"] = ticker
hists.append(hist)
df = pd.concat(hists)
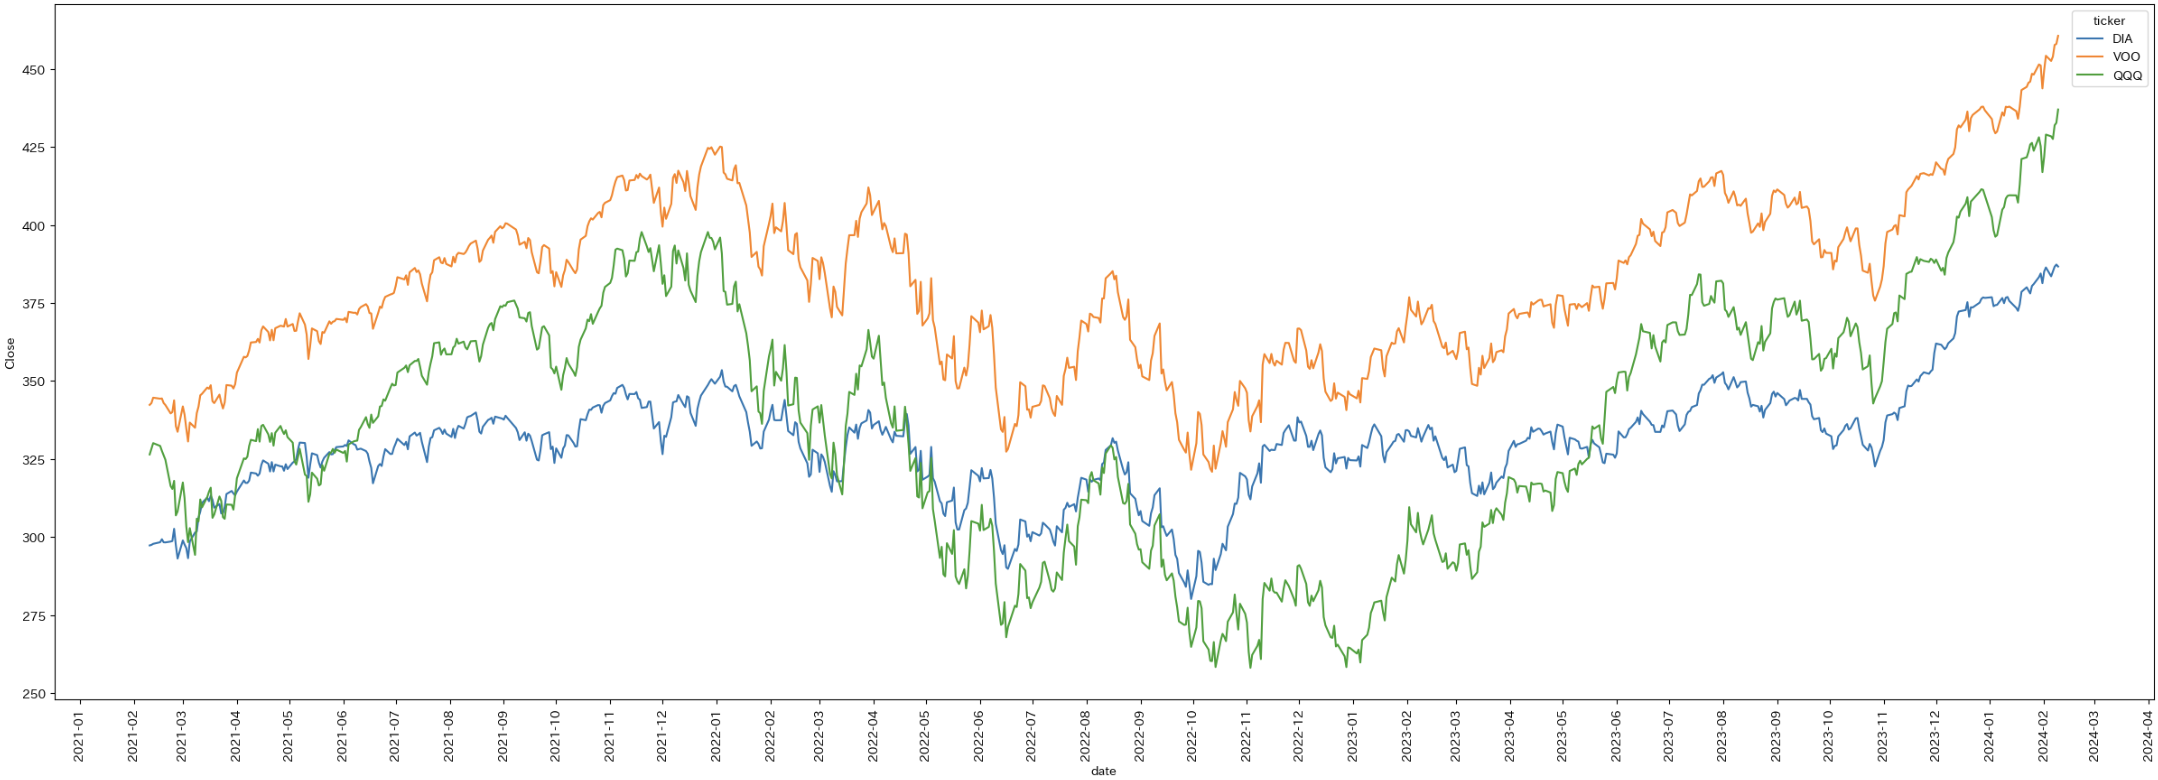
plt.figure(figsize=(30, 10))
ax = sns.lineplot(data=df, x="date", y="Close", hue="ticker")
ax.xaxis.set_major_locator(mdates.MonthLocator())
ax.set_xticklabels(ax.get_xticklabels(), rotation=90)