plotly sankey diagram
date: 2025-01-05 excerpt: plotly sankey diagram(サンキー図)のサンプルコード
plotly sankey diagram(サンキー図)
概要
- plotlyでサンキー図を作成する方法について記載
サンプルコード
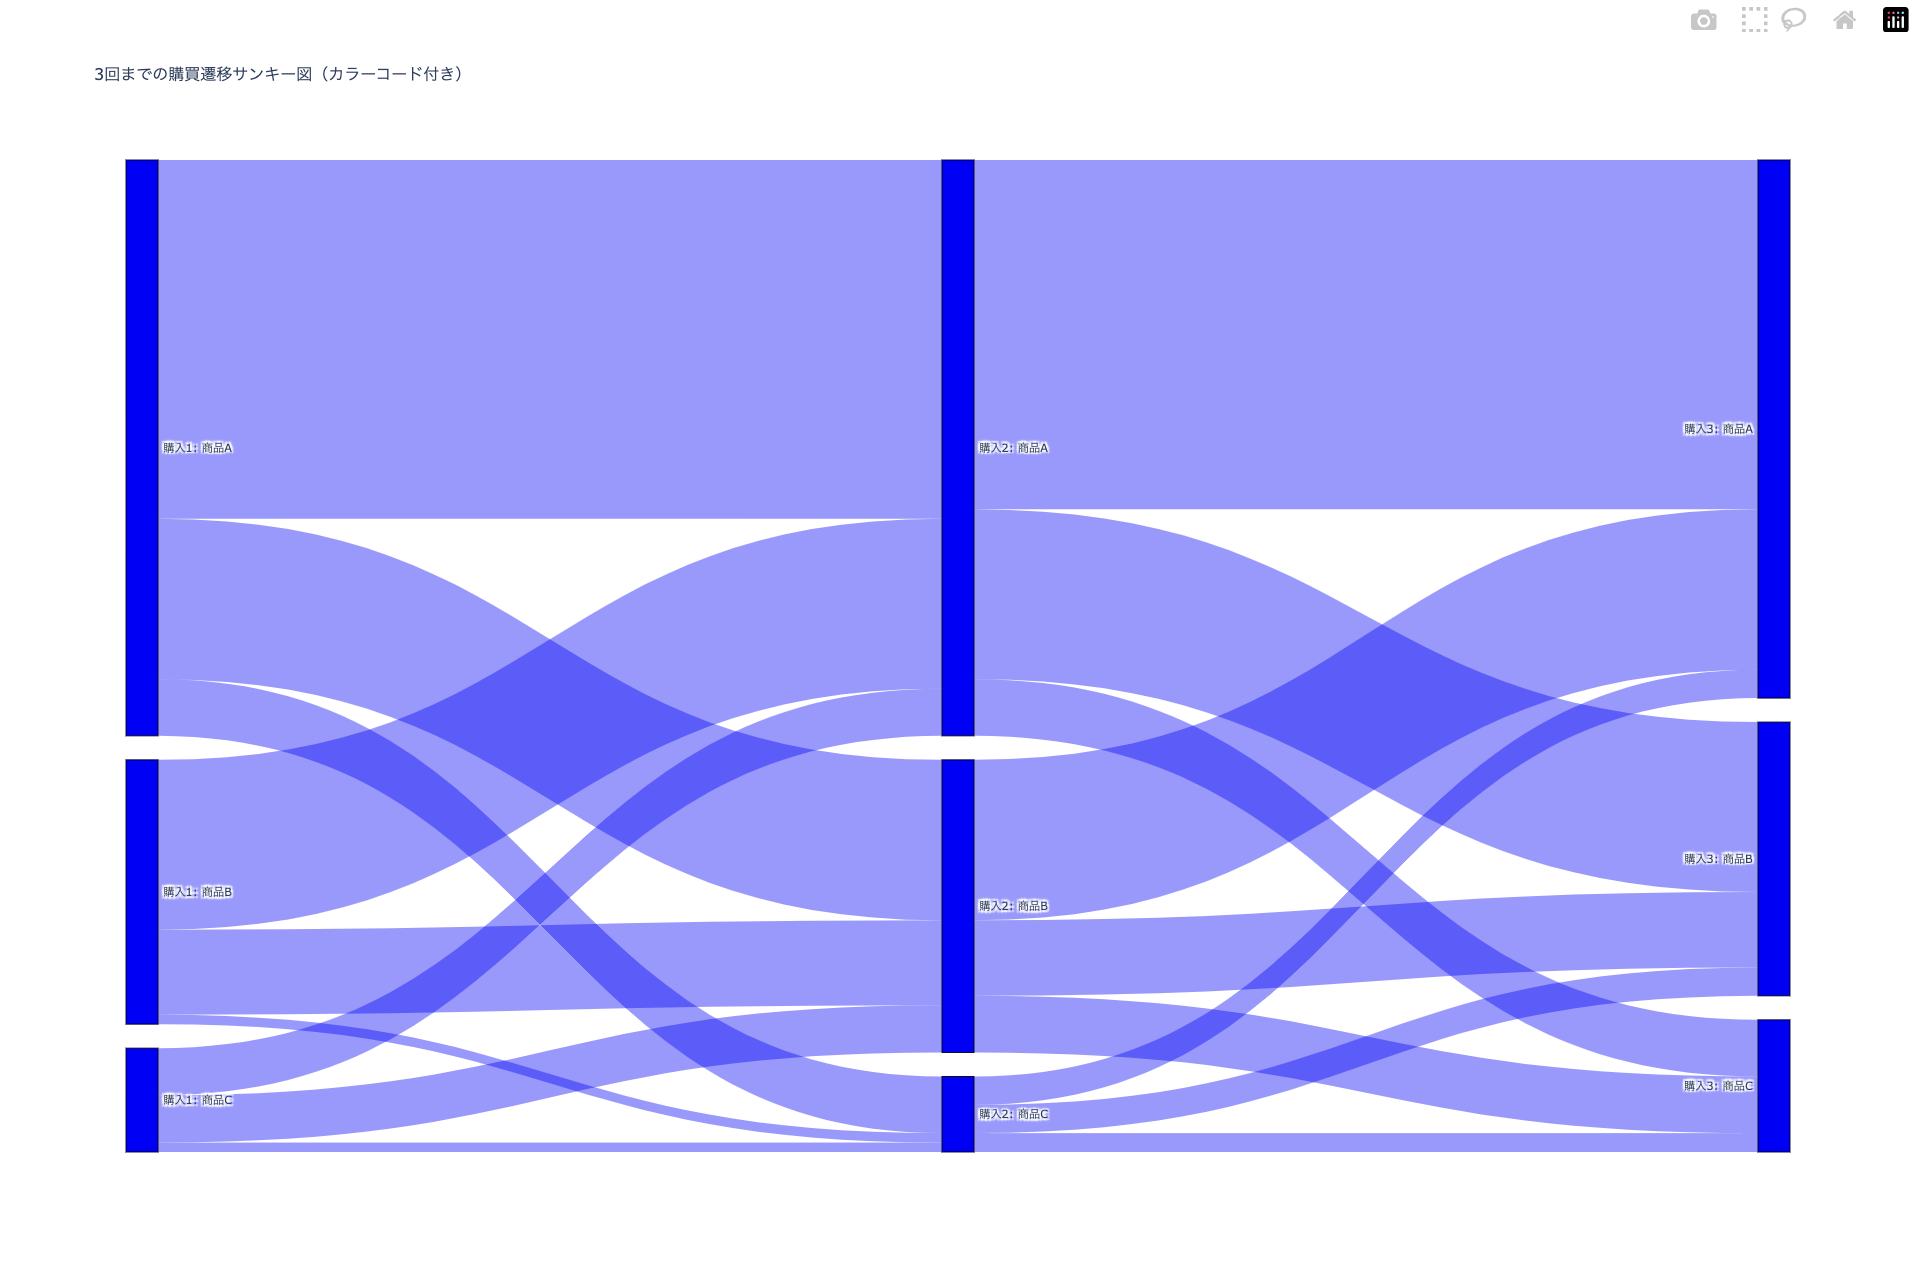
- ユーザの購買行動をサンキー図で可視化するサンプルコード
import pandas as pd
import numpy as np
import plotly.graph_objects as go

# ダミーデータの作成
df = pd.DataFrame({
    "1": np.random.choice(["商品A", "商品B", "商品C"], size=(100,), p=[0.6, 0.3, 0.1], replace=True),
    "2": np.random.choice(["商品A", "商品B", "商品C"], size=(100,), p=[0.6, 0.3, 0.1], replace=True),
    "3": np.random.choice(["商品A", "商品B", "商品C"], size=(100,), p=[0.6, 0.3, 0.1], replace=True),
})

# 購入1から購入2への遷移を抽出
transitions_1_to_2 = df[['1', '2']].rename(columns={'1': 'source', '2': 'target'})
transitions_1_to_2['source_label'] = transitions_1_to_2['source'].apply(lambda x: f"購入1: {x}")
transitions_1_to_2['target_label'] = transitions_1_to_2['target'].apply(lambda x: f"購入2: {x}")

# 購入2から購入3への遷移を抽出
transitions_2_to_3 = df[['2', '3']].rename(columns={'2': 'source', '3': 'target'})
transitions_2_to_3['source_label'] = transitions_2_to_3['source'].apply(lambda x: f"購入2: {x}")
transitions_2_to_3['target_label'] = transitions_2_to_3['target'].apply(lambda x: f"購入3: {x}")

# 全ての遷移を結合
transitions_all = pd.concat([transitions_1_to_2, transitions_2_to_3], ignore_index=True)

# 遷移の集計(同じ遷移が複数行ある場合に合計)
transition_counts = transitions_all.groupby(['source_label', 'target_label']).agg(value=('target_label', 'size')).reset_index()

# print(transition_counts.head())
# 一意のノードをリストアップ
unique_nodes = pd.unique(transition_counts[['source_label', 'target_label']].values.ravel('K'))
node_to_index = {node: idx for idx, node in enumerate(unique_nodes)}

# ソースとターゲットのインデックスを取得
transition_counts['source_id'] = transition_counts['source_label'].map(node_to_index)
transition_counts['target_id'] = transition_counts['target_label'].map(node_to_index)

# ソース、ターゲット、値のリストを作成
source = transition_counts['source_id'].tolist()
target = transition_counts['target_id'].tolist()
value = transition_counts['value'].tolist()
labels = unique_nodes.tolist()

# サンキー図の作成
fig = go.Figure(data=[go.Sankey(
    node=dict(
        pad=15,
        thickness=20,
        line=dict(color="black", width=0.5),
        label=labels,
        color="blue"  # ノードの色(任意)
    ),
    link=dict(
        source=source,
        target=target,
        value=value,
        color="rgba(0, 0, 255, 0.4)"  # リンクの色(任意)
    )
)])

# 図のサイズを指定(幅と高さをピクセル単位で設定)
fig.update_layout(
    title_text="3回までの購買遷移サンキー図(カラーコード付き)",
    font_size=7,
    width=1200,    # 幅を大きくする(例: 1200ピクセル)
    height=800     # 高さを大きくする(例: 800ピクセル)
)

fig.show()