numpy polyfitの概要と使い方
概要
- 任意の次数でフィットして(次数が高い)線形的なモデルを作ることができる機能
- Excelの近似曲線の機能のイメージに近い
numpy.polyfit
- Args
- x
- y
- deg
- 次数(1でy = a x + b)
- Returns
- 指定した次数のcoefficients
numpy.poly1d
- Args
- coefficients
- Returns
- coefficientsを適応した関数
具体例
import numpy as np
import matplotlib.pyplot as plt

x = np.array([0, 1, 2, 3, 4, 5])
y = np.array([0, 0.8, 2.2, 2.8, 4.5, 5.1])

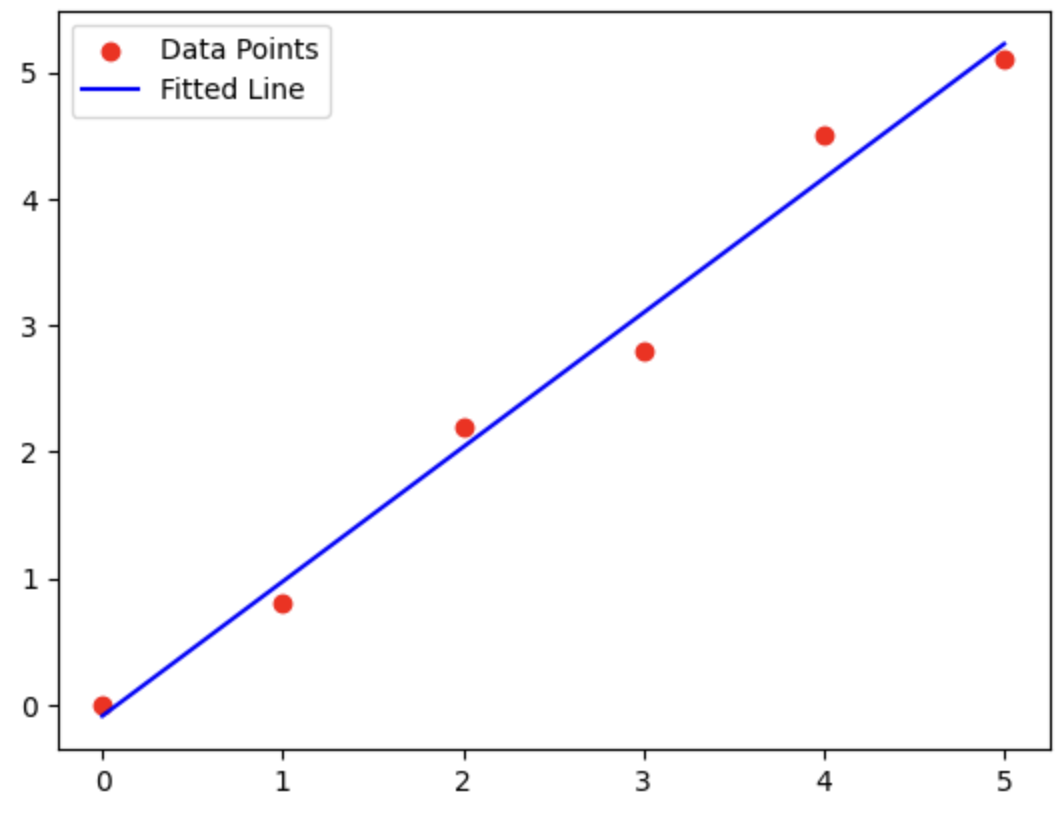
coeffs = np.polyfit(x=x, y=y, deg=1) # 次数
print(coeffs)  # 結果は、[傾き, 切片]
"""
[ 1.06285714 -0.09047619]
"""

p = np.poly1d(coeffs)

plt.scatter(x, y, color='red', label='Data Points')
plt.plot(x, p(x), color='blue', label='Fitted Line')
plt.legend()
plt.show()

p = np.poly1d([3, 2, -1])  # これは 3x^2 + 2x - 1 を表現
print(p)
"""
  2
3 x + 2 x - 1
"""
print(p(1))  # x=1 での評価
"""
4
"""