ヒルベルト曲線について
概要
- 空間充填曲線(space-filling curve)の一つ
- 任意の自然数のベクトルが与えられたとき、そのベクトルをヒルベルト曲線に変換することができる
- 一次元のベクトルであればヒルベルト曲線は格子状になる
- 格子状であるが、フラクタル構造と連続関数の性質を持つため曲線と呼ばれる
hilbertcurve(python)
$ pip install hilbertcurve
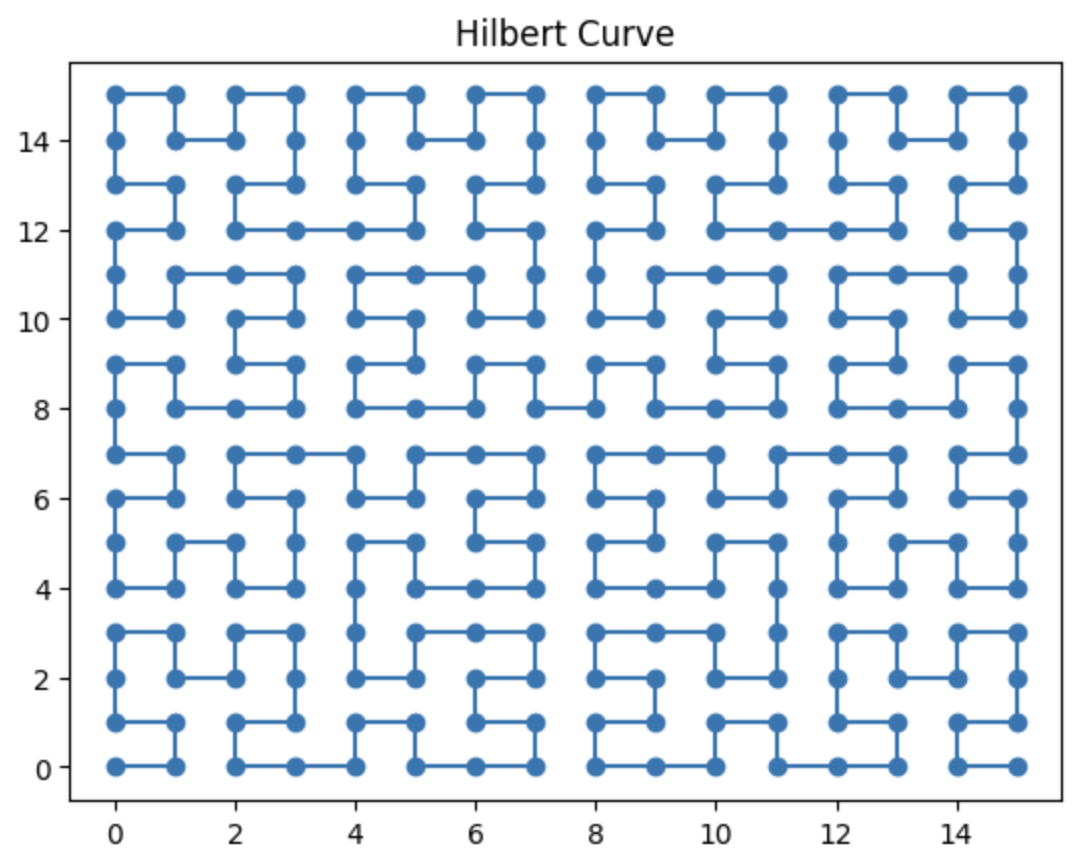
ヒルベルト曲線の描画
import matplotlib.pyplot as plt
from hilbertcurve.hilbertcurve import HilbertCurve

p = 4  # オーダー
n = 2  # 次元

hilbert_curve = HilbertCurve(p, n)

# 全インデックスの座標を計算
points = [hilbert_curve.point_from_distance(i) for i in range(2**(p*n))]

# 描画
x, y = zip(*points)
plt.plot(x, y, marker='o', linestyle='-')
plt.title('Hilbert Curve')
plt.show()
任意の次元のベクトルをヒルベルト曲線に変換
import pandas as pd
import numpy as np
import matplotlib.pyplot as plt
from sklearn.preprocessing import MinMaxScaler
from hilbertcurve.hilbertcurve import HilbertCurve
# 1. データ生成
n_samples = 5000
n_clusters = 5
data = np.random.random((n_samples, 2))
# pandas DataFrameに変換
df = pd.DataFrame(data, columns=['x', 'y'])
# 2. データのスケーリング([0, 1]範囲に)
scaler = MinMaxScaler()
df[['x_scaled', 'y_scaled']] = scaler.fit_transform(df[['x', 'y']])
# 3. ヒルベルト曲線による一次元マッピング
p = 10 # ヒルベルト曲線の次数(精度)
N = 2 # 次元数
hilbert_curve = HilbertCurve(p, N)
# スケーリングした座標を整数に変換
coords = df[['x_scaled', 'y_scaled']].values * (2**p - 1)
coords = coords.astype(int)
# ヒルベルトインデックスの計算
hilbert_indices = []
for coord in coords:
index = hilbert_curve.distance_from_point(coord)
hilbert_indices.append(index)
df['hilbert_index'] = hilbert_indices
# 4. quantile cutによるクラスタリング
n_bins = n_clusters # クラスタ数と同じビン数
df['cluster'] = pd.qcut(df['hilbert_index'], q=n_bins, labels=False)
# クラスタごとのサンプル数を表示
cluster_counts = df['cluster'].value_counts().sort_index()
print("クラスタごとのサンプル数:")
print(cluster_counts)
# 5. 結果の可視化
plt.figure(figsize=(8, 6))
colors = ['red', 'green', 'blue', 'purple', 'orange', 'brown', 'pink', 'gray', 'olive', 'cyan']
for cluster in range(n_clusters):
cluster_data = df[df['cluster'] == cluster]
plt.scatter(cluster_data['x'], cluster_data['y'], color=colors[cluster % len(colors)], label=f'Cluster {cluster}', alpha=0.6)
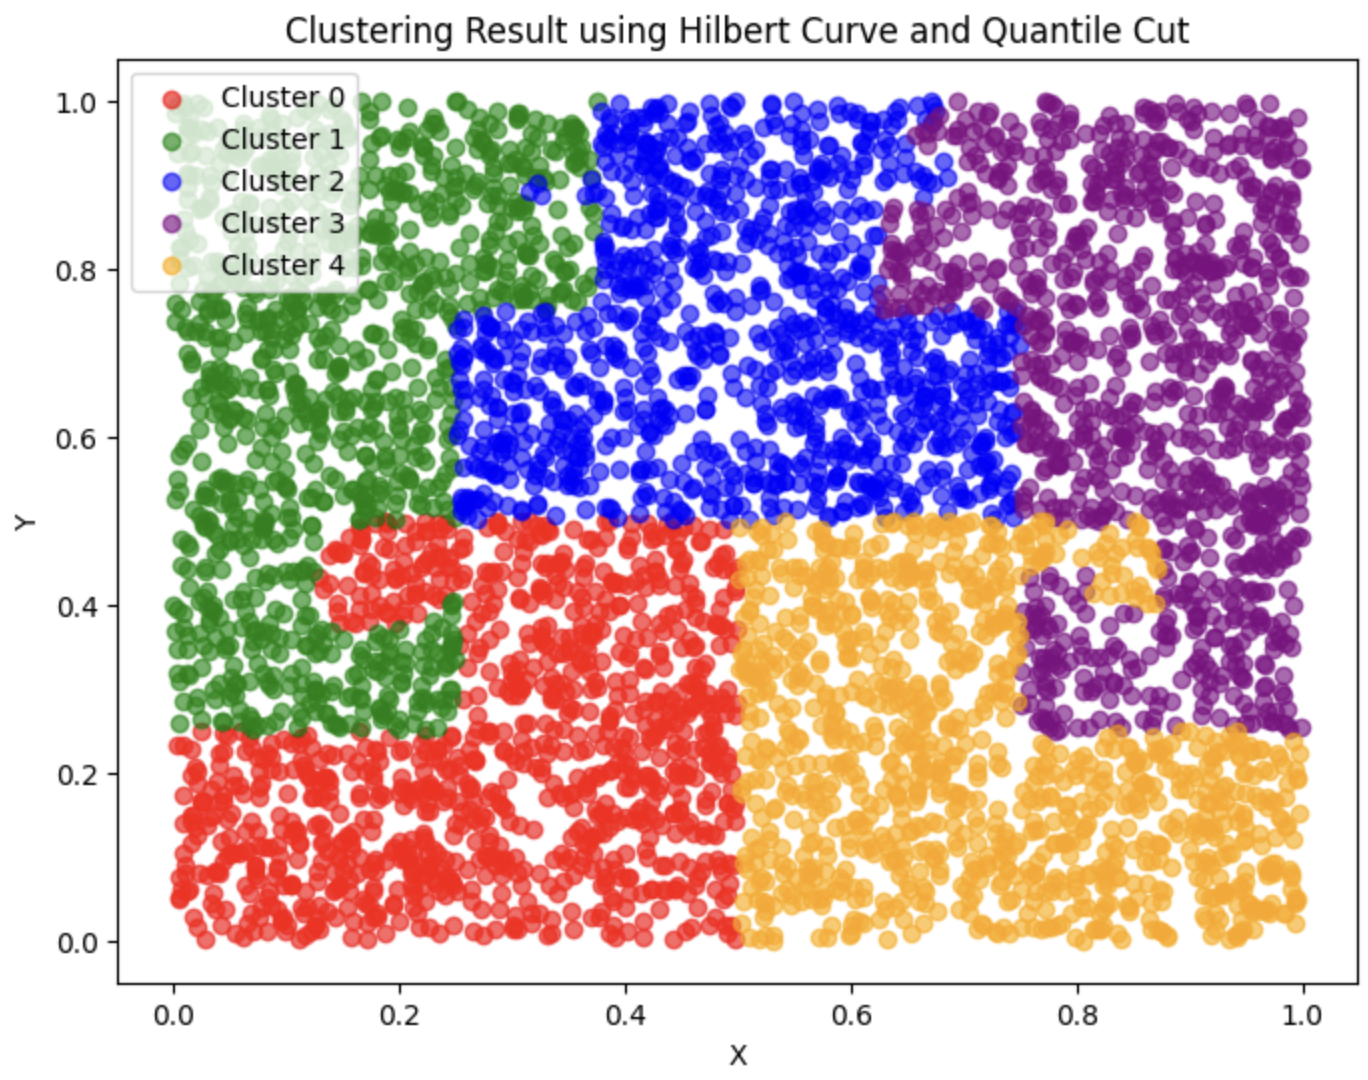
plt.title('Clustering Result using Hilbert Curve and Quantile Cut')
plt.xlabel('X')
plt.ylabel('Y')
plt.legend()
plt.show()